BathyVision
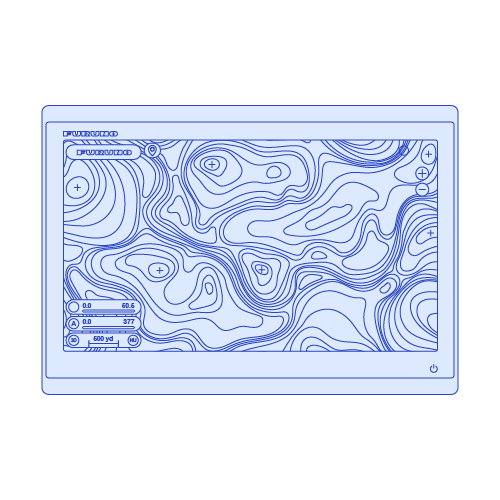
BathyVision provides high-resolution, dynamic bottom data displayed intuitively in color with configurable contour lines.
What is BathyVision?
BathyVision is a technology that provides high-quality bottom data, displayed dynamically in color with adjustable contour lines for precise and accurate focus.
Furuno’s BathyVision revolutionizes bathymetric data visualization with contour lines adjustable to a remarkable three-inch interval, offering three times the detail of other charts.
It uncovers underwater features like hidden depressions and pinnacles, potentially revealing new fishing spots with trophy fish you might have overlooked.
FURUNO TECHNOLOGY
Product Manager
at Furuno
"BathyVision on NavNet TZtouchXL multifunction displays revolutionizes bathymetric visualization with unparalleled three-inch contour detail, revealing hidden underwater features. Its seamless integration and 3D-like terrain shading redefine precision in marine navigation and fishing."

BathyVision for Dynamic, Intuitive Fishing Area Exploration
With BathyVision's diverse features, the mysteries of the seabed are unveiled! TZ MAPS provides top-notch bottom data, allowing you to view it dynamically and intuitively in color or with contour lines. You can adjust the contour line density and shading to precisely target high-potential fishing zones.
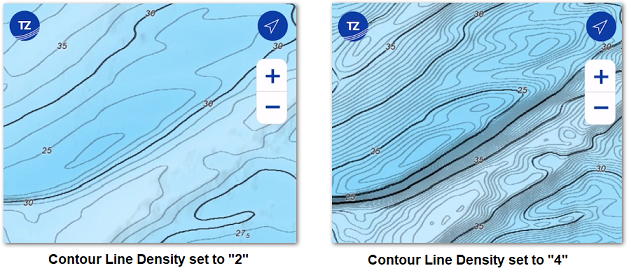
Contour line Density & Smoothing
The contour line interval adjusts automatically based on the zoom level, but you can also choose a density level manually. We recommend experimenting with the density settings, as areas with diverse terrain and slopes might benefit from different contour line densities. If the contour lines are set to a very high density, they can appear overly sharp and make the display look "noisy." This can result in numerous small, isolated areas that hinder readability. To mitigate this, you can apply an averaging filter to smooth out the contour lines.
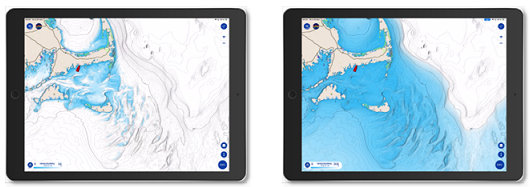
Color Gradient Depth Range
The background of the chart features a color gradient transitioning from blue for shallow waters to white for deeper waters. To enhance contrast in either shallow or deep regions, you can modify the deep water threshold between 20 and 300 feet by tapping on the depth value.
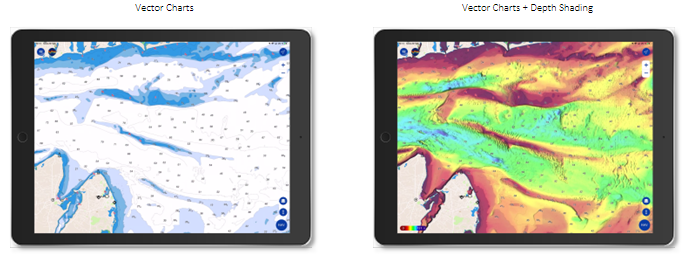
Depth Shading
To visualize bathymetric data with a vivid color scale, activate the Depth Shading overlay. This overlay can be applied to any chart type, including Vector, Raster, or BathyVision. The color scale's minimum and maximum values are automatically determined. You can adjust the color palette and the transparency of the depth shading in the plotter settings.
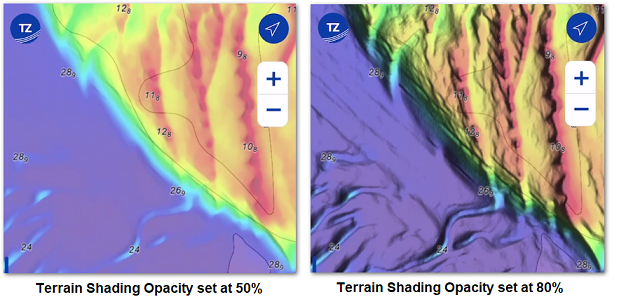
Terrain Shading opacity
When BathyVision is activated or the Depth Shading overlay is turned on, the screen automatically applies a Terrain Shading opacity. By default, this opacity is set to 50%, but it can be modified in the plotter settings under "Terrain Shading Opacity" at the page's bottom. In certain regions, increasing the opacity may dramatically enhance the visibility of the seabed.
Chartplotter - Seamless Navigation Solutions for Every Maritime Sector
Furuno chartplotters are renowned for their user-friendly interface, ensuring seamless navigation for all maritime sectors. Their high-performance capabilities deliver precise and real-time data, enhancing safety and efficiency on the water. Built with reliability in mind, these chartplotters withstand harsh marine environments, making them an indispensable tool for commercial, recreational, and professional mariners alike, ensuring smooth sailing every time.
Furuno's BathyVision 3D Bathymetry Now For Everyone
D=2.2(√H1 + √H2)
D: Radar line-of-sight (NM)
H1: Altitude at which the Radar is installed (m)
H2:Altitude of the object reverberating the signal (m)
Products employing this radar technology
These radars were developed to guarantee situational awareness as they reliably and intuitively track dangerous targets.
Products employing this chartplotter technology
These chartplotters include chart data revealing underwater features you may have never noticed.


RADAR
Our radars deliver accurate images and reliability in all environments, combining superior performance with durability against harsh conditions.
SONAR
Our sonar technologies offer unparalleled accuracy and sustainability, ensuring optimal performance and eco-friendly practices for all fishing vessels.
FISH FINDER
Furuno's fish finder technologies have revolutionized fishing, offering unparalleled accuracy and reliability since their inception.
AUTOPILOT
Furuno's autopilot technologies enhance navigation safety and precision through advanced algorithms, real-time adjustments, and user-friendly interfaces.
CHARTPLOTTER
Our chartplotter technologies enhance maritime safety and simplify navigation by providing real-time data, precise positioning, and the best marine charts.
USER INTERFACE
User interface technologies simplify marine instrument operation, enhancing navigation efficiency and safety with intuitive, user-friendly controls.
ACCESORIES
Contact one of our departments to solve your problem


1815
€120
VAT Included (20%)

1815
€120
VAT Included (20%)

1815
€120
VAT Included (20%)

1815
€120
VAT Included (20%)

1815
€120
VAT Included (20%)

1815
€120
VAT Included (20%)